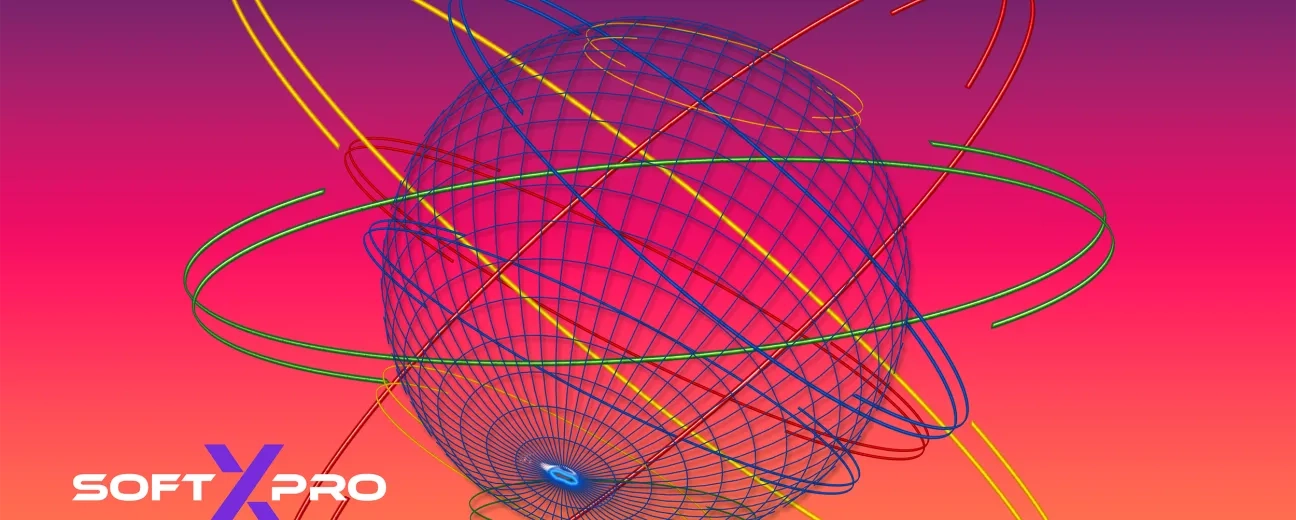
Why 3D Interactive Visualizations Are the Future of Web Design

Flat charts are out. Immersive, interactive 3D data is in.
In a world where attention spans are shrinking and data complexity is growing, 3D interactive visualizations are emerging as the bridge between insight and engagement. They do more than just display information. They invite users to explore, manipulate, and understand data in ways that static visuals never could.
Why 3D Visualization Matters Now
Modern websites are no longer just digital brochures. They are dynamic platforms for storytelling, decision-making, and user interaction. As businesses compete for attention, the ability to present complex information in an engaging, intuitive format becomes a strategic advantage.
According to Fuselab Creative, immersive data experiences are among the top visualization trends for 2025. These include 3D models, VR-ready interfaces, and AI-enhanced visuals that allow users to rotate, zoom, and pan through datasets in real time.
But what does this mean for your website or platform?
It means the difference between passive viewing and active exploration. Between bounce rates and conversions. Between confusion and clarity.
Real-World Examples of 3D Visualization in Action
Some of the most compelling use cases of 3D website visualization come from industries where data complexity is high and user engagement is critical.
- NASA's Eyes on Earth: This platform features live 3D satellite visuals, allowing users to track environmental changes in real time. It transforms raw data into a visual journey through space and time.
- Windy: A weather visualization service that uses stunning 3D animations to show wind patterns, temperature shifts, and storm movements globally.
These examples, highlighted by htmlBurger, demonstrate how interactive web graphics can turn complex datasets into intuitive, engaging experiences.
Imagine your users being able to explore your data like they would a 3D map or product model. What would that do for your engagement metrics?
From E-commerce to Urban Planning: Broad Applications
3D interactive visualizations are not just for science or weather. They are transforming e-commerce, real estate, education, and even urban planning.
Take the example of Interior Define, a furniture brand that used Cylindo’s 3D platform to allow customers to customize products in real time. The result? Higher engagement, fewer product returns, and a more confident buying experience.
In urban planning, platforms like UrbanFootprint use 3D data extrusion to visualize employment density and land use patterns. This helps city planners identify spatial trends and make informed decisions faster, as shown in this case study.
Whether you are selling sofas or shaping cities, 3D visualization adds a new layer of clarity and interactivity to your data.
Tools and Platforms Powering the Trend
The rise of low-code and no-code platforms has made 3D visualization more accessible than ever. Tools like Sketchfab and Zolak offer embedded 3D viewers that integrate seamlessly into websites, allowing for real-time interaction without heavy development overhead.
As noted in Zolak’s 2025 review, these platforms are especially effective in e-commerce, where shoppers can rotate, zoom, and customize products before purchase. This not only enhances the user experience but also boosts conversion rates.
At SoftXPro, we integrate these technologies into custom web platforms that are both visually stunning and functionally powerful. Explore our custom website design services to see how we bring 3D interactivity to life.
Design Principles for Effective 3D Visualizations
While the technology is powerful, effective 3D visualization requires thoughtful design. Here are some key principles to keep in mind:
- Clarity over complexity: Avoid overwhelming users with too many controls or data points.
- Contextual storytelling: Use motion and interaction to guide users through a narrative.
- Performance optimization: Ensure fast load times and smooth rendering across devices.
- Accessibility: Provide alternative views or descriptions for users with different needs.
Remember, the goal is not to impress with tech, but to inform and engage with purpose.
Looking Ahead: The Future of Interactive Web Graphics
As AI continues to evolve, we can expect even more intelligent visualizations that adapt to user behavior, personalize content, and automate insights. Combined with 3D and AR technologies, the web is becoming a truly immersive environment.
Businesses that embrace this shift early will not only stand out visually but also empower their users to make better, faster decisions.
Want to see what this looks like in action? Browse our portfolio of interactive web platforms built for forward-thinking brands.
Conclusion: Make Your Data Speak in 3D
3D interactive visualizations are more than a design trend. They are a strategic tool for engagement, clarity, and conversion. Whether you are presenting complex analytics, showcasing products, or guiding users through spatial data, 3D brings your content to life.
Ready to elevate your website with immersive data experiences? Let SoftXPro help you build a platform that turns data into dialogue.
See how SoftXPro has transformed businesses like yours → Explore our portfolio
